 Skip to content
Top 10 Data Analytics Tools To Learn In 2022

You must have noticed that data analytics tools are becoming a “must-have” in the corporate IT arsenal.
With Business Intelligence and information analysis playing a central role in the operations of all kinds of organisations, knowing how to leverage the power of data analytics tools has become a competitive advantage.
Primary responsibility for managing and extracting insights from business data typically lies with dedicated professionals such as data scientists and big data engineers. But these insights have to be made accessible and meaningful to other stakeholders in the enterprise, who may not have a technical background.
However, not all data analytics tools are appropriate for every circumstance.
In this article, we’ve assembled 10 of the best and most popular data analytics tools to consider in 2022 - a selection that covers a wide range of usage scenarios, and which have applications in organisations of all types and sizes. These data analytics tools range from free to fully serviced commercial packages.
#1 Data Analytics Tool - Tableau
![]()
(Image source: Tableau)
About Tableau
Tableau is a market-leading data analytics tool used for analysing and visualising data and has been named as a Leader in the Gartner Magic Quadrant 2021 for the ninth consecutive year.
With an emphasis on ease of use, Tableau enables users to work on live data-sets and spend more time on Data Analysis rather than Data Wrangling.
The Tableau family of products includes Tableau Desktop, Tableau Server, Tableau Online, Tableau Reader, and Tableau Public. Of these, Tableau Public is free software that you can use to make visualisations - but you need to save your workbook or worksheets in the Tableau Server which can be viewed by anyone.
Tableau Dashboard
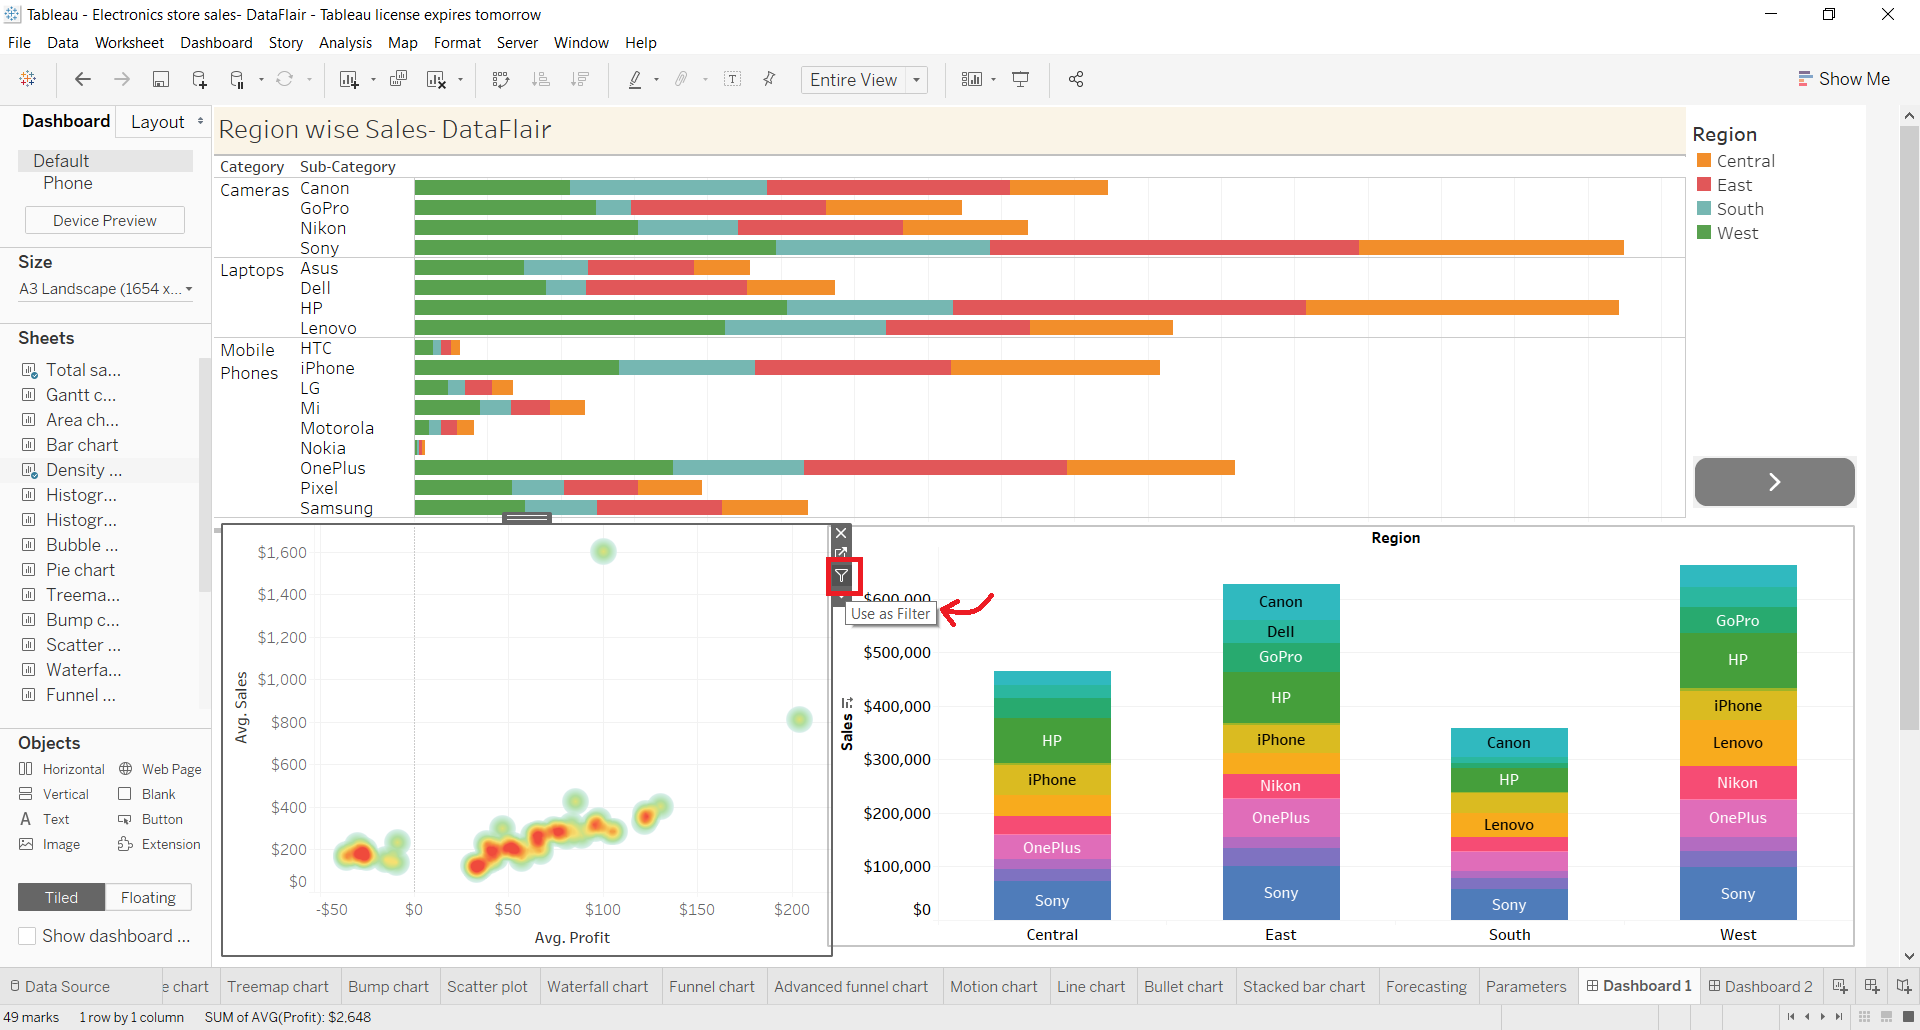 (Image source: Data Flair Training)
Tableau continues to evolve, and new features are enabling users to create Smart Dashboards, perform faster analytics, update the system automatically, and publish a dashboard to share it live on the web, and on mobile devices.
Tableau offers customisable dashboards and real-time data in visual methods for exploration and analysis.
Top Companies Using Tableau
Multinational organisations such as Citibank, Deloitte, Skype, and Audi use Tableau to visualise their data and generate meaningful insights.
Tableau Pricing Information
Tableau Creator enables users to discover insights faster by combining a powerful suite of products for visual data preparation, best-in-class analytics, and secure collaboration to support end-to-end analytical workflows. It’s priced at $70 per user per month, billed annually.
Tableau Training As A Service
Want to learn Tableau to derive useful insights through data visualisation? Here at zsah, we partner with Tableau to offer Tableau Training As A Service.
Within just a few weeks, you will learn everything you need to know about Tableau from zsah's data analytics experts through our innovative Augmented Learning method!
Drop us a message if you also want to become a Tableau Master!
#2 Data Analytics Tool - Python
(Image source: KDNuggets.com)
About Python
Not a branded platform in itself, Python is one of the top programming languages used in the data analytics field. It’s a high level, interpreted language that has an easy syntax and dynamic semantics.
In recent years, a number of Python libraries have reached maturity, allowing users of R and Stata to take advantage of the flexibility and performance of Python, without sacrificing the functionality of these older languages.
Among the core skills needed to work in Python is setting up Python on your computer using the Anaconda distribution, an open-source Python and R data science platform that enables users to perform data science and machine learning on Linux, Windows, and Mac OS.
This platform permits users to download over 1,500 Python and R data science packages, oversee libraries, dependencies, and environments, and to analyse data with Dask, NumPy, pandas, and Numba.
Python Dashboard
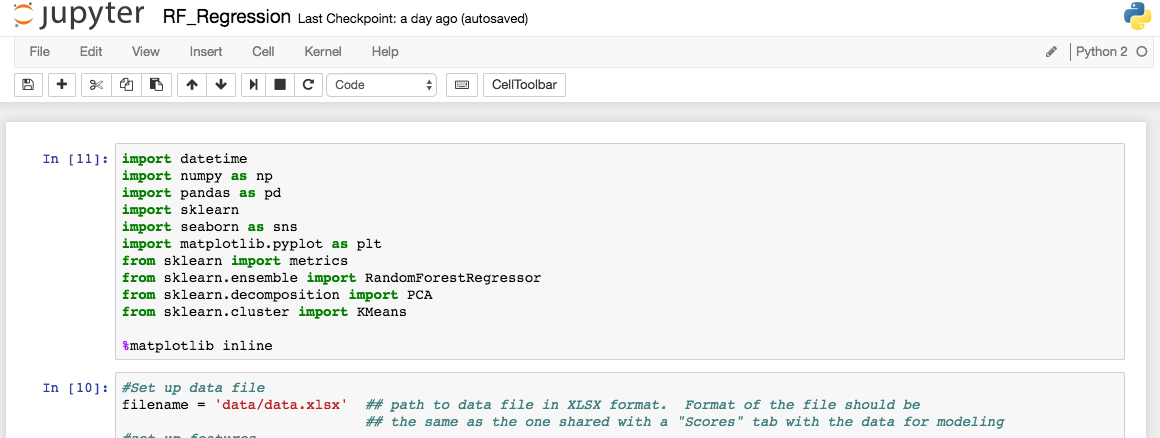
(Image source: PythonData.com)
Python was explicitly designed so that code written in the language would be easy for humans to read, and to minimize the amount of time required to write that code.
It’s a full-blown programming language rather than a domain-specific language, which can only serve a specific purpose, and work for a specific audience. Although Python does require more training than a domain-specific language to get a basic grounding, once mastered there’s theoretically no limit to what you can achieve with it.
In terms of computational speed and memory use, Python has some major performance advantages over most other high-level programming languages. And there are new tools emerging that make it possible to write code in Python that runs at speeds an order of magnitude greater than R or native Python.
Top Companies Using Python
Household names including Industrial Light and Magic, Google, Facebook, Instagram, Spotify, Quora, Netflix, and Dropbox use Python in their data analytics.
Python Pricing Information
The cost of a Python data analytics deployment will depend on the nature and size of the project, the programming talent available, budget, and other concerns specific to the organisation.
#3 Data Analytics Tool - Apache Spark
(Image source: Apache Spark)
About Apache Spark
One of the most successful projects of the Apache Software Foundation, Apache Spark is an open-source cluster computing framework that performs real-time data processing. Currently, on version 2.4.6, the latest iteration (version 3.0.0) is in preview.
If you need big data analysis on a budget, Apache Spark is definitely worth considering. The speed and scalability of Spark’s engine make it a very popular data analytics tool among data scientists.
In addition to its core analytics function, Apache Spark may be used for a variety of functions, including cleansing and transforming data, building models for evaluation and scoring, and determining data science pipelines for production.
Apache Spark's software provides high-level APIs (application programming interfaces) in Java, Scala, Python and R, and its code can be written in any of these four languages.
Apache Spark Dashboard
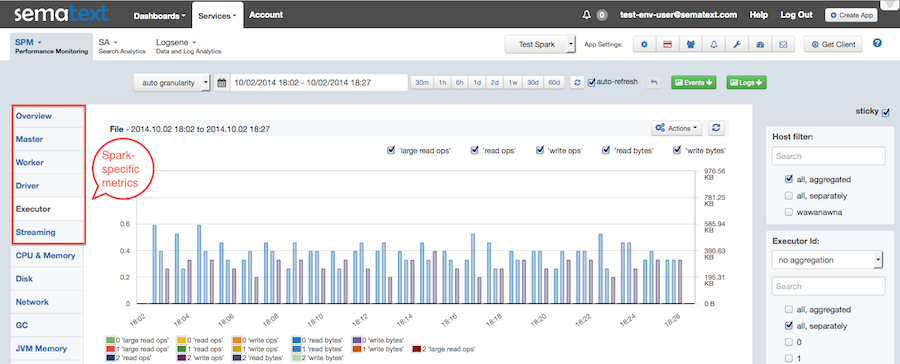
(Image source: Sematext)
Apache Spark comes with an interface for programming, which ensures fault tolerance and implicit data parallelism.
The system’s “lazy execution” feature allows you to set a series of complex transformations, and have them represent as a single object. This enables analysts to inspect the structure of a transformation and its end result, without executing individual steps along the way.
Apache Spark even checks for errors in the execution plan before submitting it, which prevents bad code from hijacking the process. It also simplifies the process of pivoting data in major data frameworks - a process that usually requires several different case statements to execute in SQL.
Top Companies Using Apache Spark
Companies such as Oracle, Hortonworks, Verizon, and Visa use Apache Spark for real-time computation of data. Systems can run on Kubernetes, Apache Mesos, Hadoop, in standalone mode, or in the cloud.
Apache Spark Pricing Information
Free version of Apache Spark offers 5GB of file storage for a team, with shared drafts for two active collaborators, and five email templates per team.
Premium version of Apache Spark charges $6.39 per active user per month, billed annually. This offers 10GB of file storage per team member, with an unlimited number of collaborators and email templates, and team roles and control for administration.
#4 Data Analytics Tool - Sisense
(Image source: Sisense.com)
About Sisense
Sisense is named as a Visionary for Ability to Execute and Completeness of Vision, in the 2021 Gartner Magic Quadrant. Seasoned users of business intelligence (BI) tools Sisense embrace as an option, because of its powerful and comprehensive set of features.
Sisense is a data analytics tool with a steep learning curve, which can be frustrating for new users. To alleviate this issue, there’s a tutorial that you can run through before you run your data, which covers the basics of ElastiCube, the Sisense proprietary database for analysing data.
The tutorial lets you experiment with data manipulation and the various features of SiSense.
Sisense Dashboard
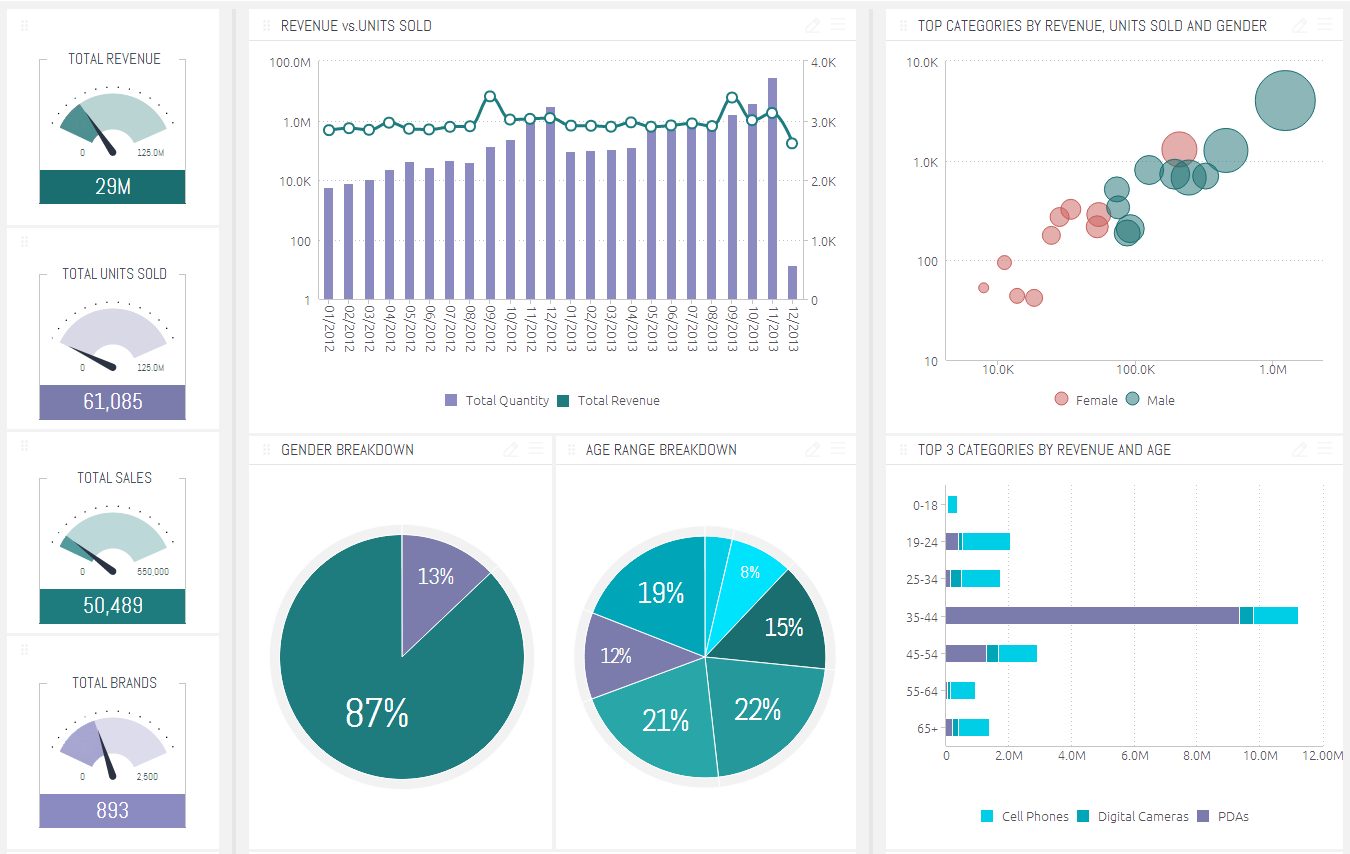
(Image source: GetApp.com)
The Sisense analytics platform greatly reduces the time it takes to build, embed, and deploy intelligent analytics apps that unleash user creativity and engagement. It claims to deliver the industry’s lowest total cost of ownership (TCO) at scale, all on a hybrid-cloud platform - whether through interactive dashboards, self-service analytics, or white-labeled BI apps.
Though many platforms offer extensive libraries of visualisations as their major selling points, Sisense limits the number of design options, in favour of deeper insight. Visualisation is implemented via interactive widgets that let users drill down to inspect different areas with a simple mouse click.
To get the most out of the platform, users have to download ElastiCube and run it on a local computer. But Sisense also has a web interface that is incredibly intuitive.
Top Companies Using Sisense
Nasdaq, Skull Candy, Quali Systems, Fujitsu, Hewlett Packard Enterprise, Motorola, Philips, and Verizon Wireless are among the organisations that rely on Sisense for data analytics.
Sisense Pricing Information
Sisense has a commitment to ‘no-surprise’ pricing, with everything from software to service included in your annual subscription plan. Prices are determined by quotation on a case by case basis.
#5 Data Analytics Tool - Splunk
(Image source: Wikimedia Commons)
About Splunk
Named by Gartner as a Visionary in the 2021 Magic Quadrant for APM, Splunk is a data analytics tool for searching, analysing, and visualising the machine-generated data gathered from applications, websites, and other sources.
The brand has developed products in various fields such as IT, Security, DevOps, and Analytics. Splunk can handle small, medium-sized, and large business enterprise data, as well as public administrations and non-profit organisations.
Splunk Dashboard
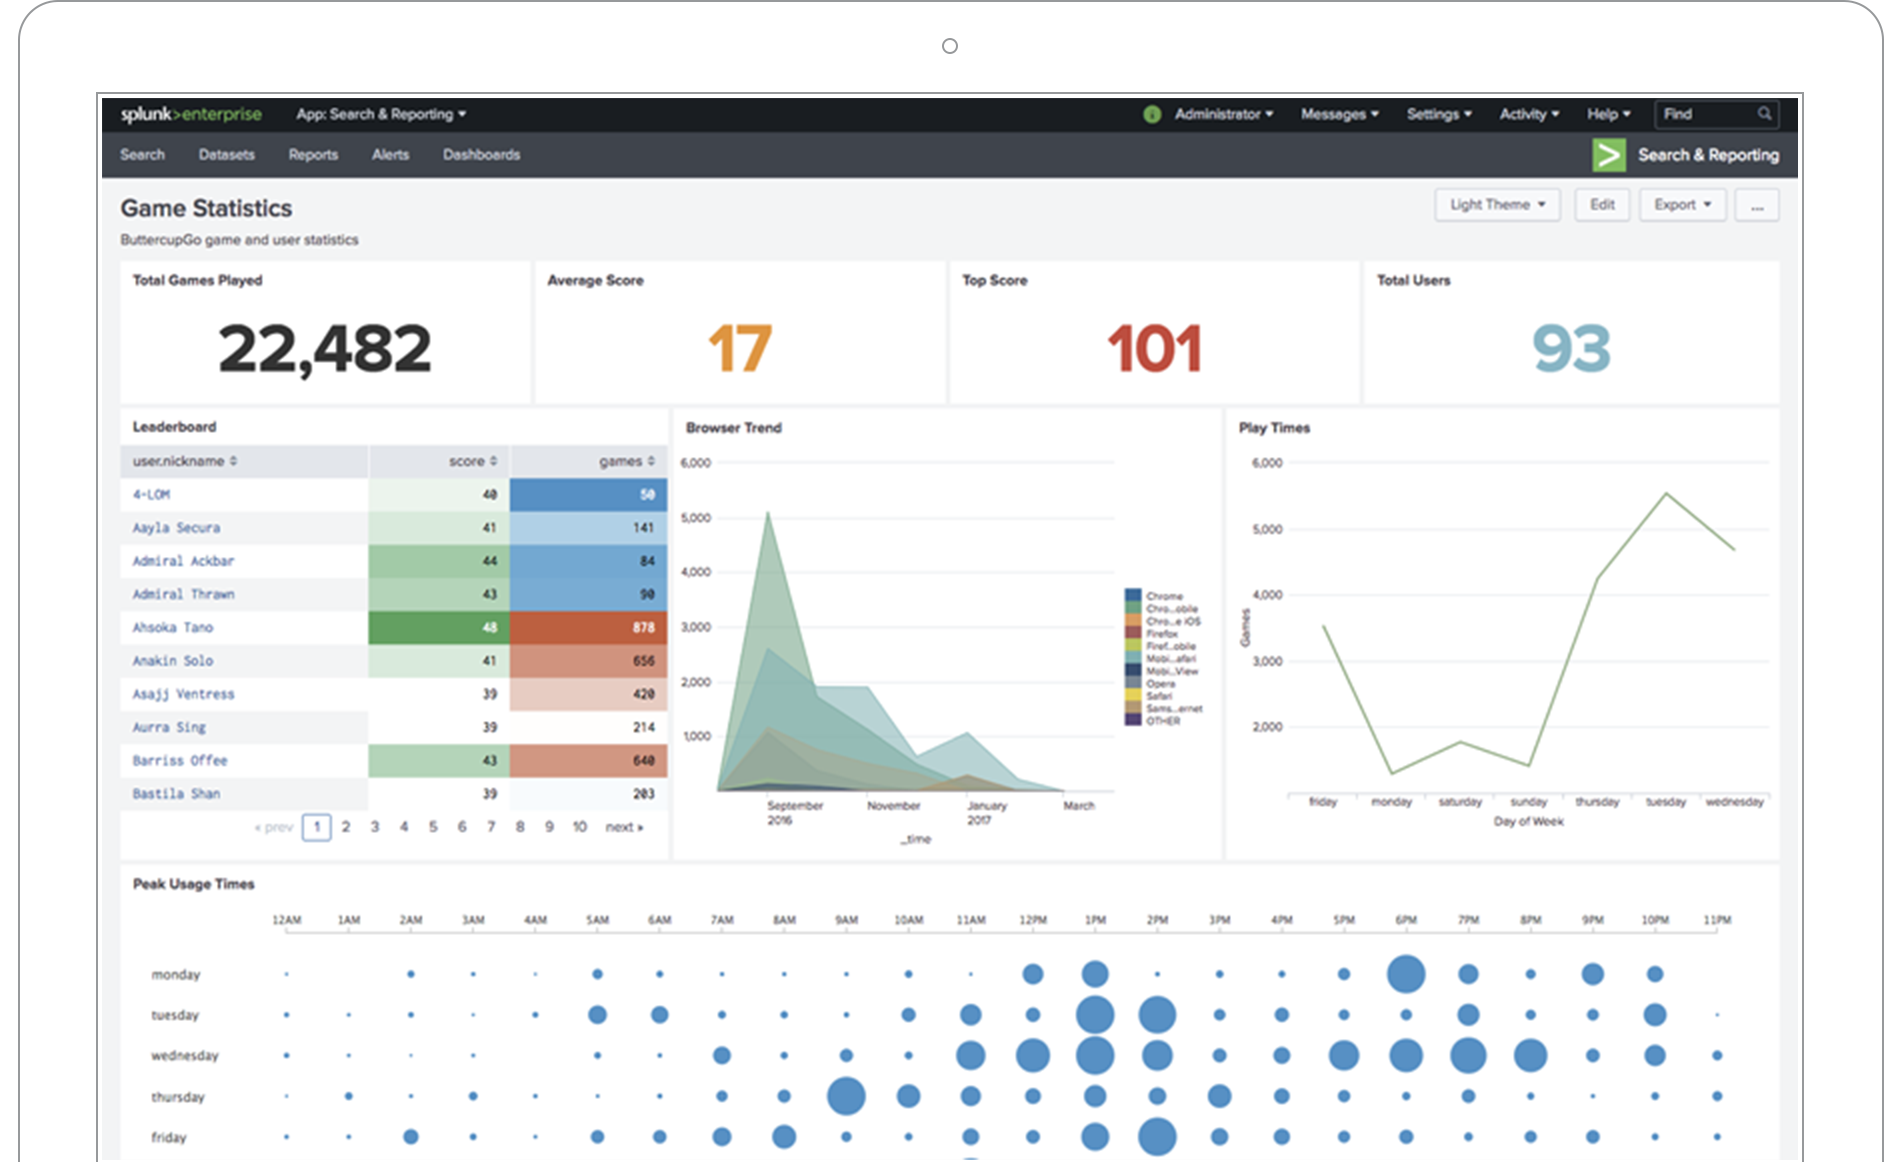
(Image source: Splunk.com)
The platform offers operational visibility, no matter what environment you’re using for access. It can be scaled or adapted to fit the needs of any organisation.
Splunk is able to collect data then index it, allowing users to search and sort it. It can also analyse and report data using an extensive range of visual reporting tools. There’s a real-time monitoring feature that gives automatic alerts if any of the data patterns are observed to be abnormal.
Top Companies Using Splunk
Splunk is trusted by 92 out of the Fortune 100, with companies such as Dominos, Otto Group, Intel, and Lenovo using it to discover processes and correlate data in real-time.
Splunk Pricing Information
Splunk ships in three forms: Splunk Free, Splunk Enterprise, and Splunk Cloud. A single-user license works for 1,000 to 4,999 and it can be deployed on-premises, through mobile devices, or through the cloud.
All three products are available for free download with trial versions. Pricing options are based on predictive pricing, Infrastructure-based pricing, and rapid adoption packages.
#6 Data Analytics Tool - Rapid Miner
(Image source: RapidMiner)
About Rapid Miner
For non-programmers and researchers looking for quick analysis of information, the RapidMiner data analytics tool makes it easy for users to define and create processes, import data into them, perform analytics and create prediction models.
Named a Visionary in the 2021 Gartner Magic Quadrant for Data Science and Machine Learning Platforms, Rapid Miner has support for importing Machine Learning models and includes integration with web applications like flask and nodeJS, and with mobile platforms like Android and iOS. This enables users to unify the entire spectrum of the big data analytics life cycle.
Rapid Miner Dashboard
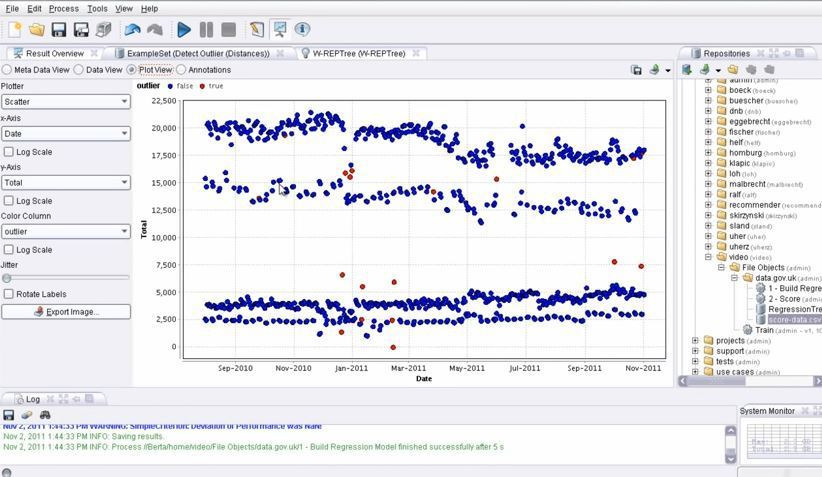
(Image source: PredictiveAnalyticsToday.com)
Products on the platform for data processing, building Machine Learning models, and deployment include Studio, GO, Server, Real-Time Scoring, and Radoop. The recent release of RapidMiner 9.6 extends the platform to full-time coders and BI Users.
Top Companies Using Rapid Miner
BMW, Hewlett Packard Enterprise, EZCater, and Sanofi are among the organisations that use RapidMiner for their Data Processing and Machine Learning models.
Rapid Miner Pricing Information
RapidMiner Studio provides a visual workflow designer for analytics teams, and starts from $7,500 – $15,000 per user, per year.
RapidMiner AI Hub offers enterprise-wide collaboration, decision automation, deployment and control, paired with high-powered computation, for $54,000 per year.
#7 Data Analytics Tool - Qlik
![]()
(Image source: SeekVectorLogo.com)
About Qlik
Qlik is a self-service Business Intelligence, Data Visualization, and Data Analytics tool, which aims to accelerate business value through data by providing features such as Data Integration, Data Literacy, and Data Analytics. The platform is named a Leader in the Gartner Magic Quadrant 2021 for Analytics and BI platforms.
Qlik incorporates a variety of products and services for Data Integration, Data Analytics, and Developer platforms. Some are available for a free trial period of 30 days.
Qlik Dashboard
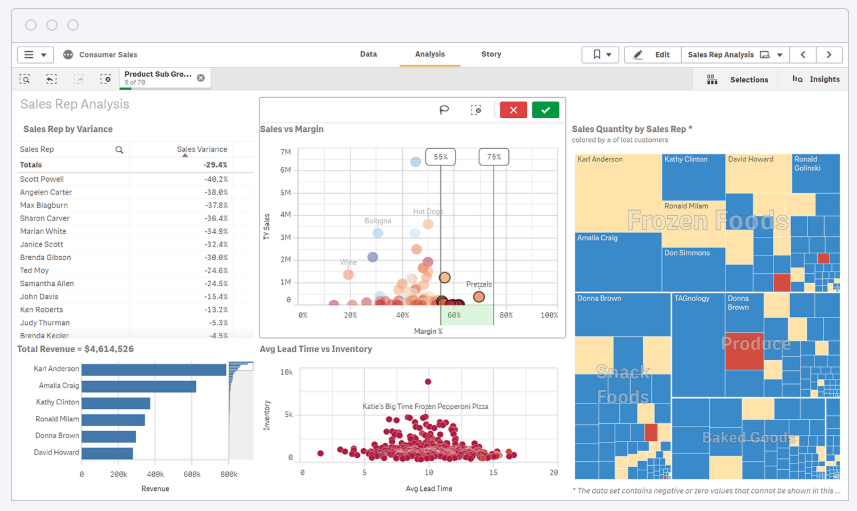
(Image source: Qlik.com)
Qlik has recently launched an intelligent alerting platform called Qlik Alerting for Qlik Sense® which helps organisations handle exceptions, and notify users of potential issues.
Tools are available to assist in deeper analysis, and the system also prompts for actions based on their derived insights.
Top Companies Using Qlik
Trusted by more than 50,000 customers worldwide, some of Qlik’s better known corporate users are CISCO, NHS, KitchenAid, and Samsung.
Qlik Pricing Information
Qlik Sense Business licenses start at $30 per user per month and offer a Software as a Service or SaaS solution for analytics across groups and teams.
Qlik Sense Enterprise offers a multi-cloud solution to scale and extend analytics across departments and organizations and starts at $70 per user per month.
#8 Data Analytics Tool - KNIME

(Image source: KNIME.com)
About KNIME
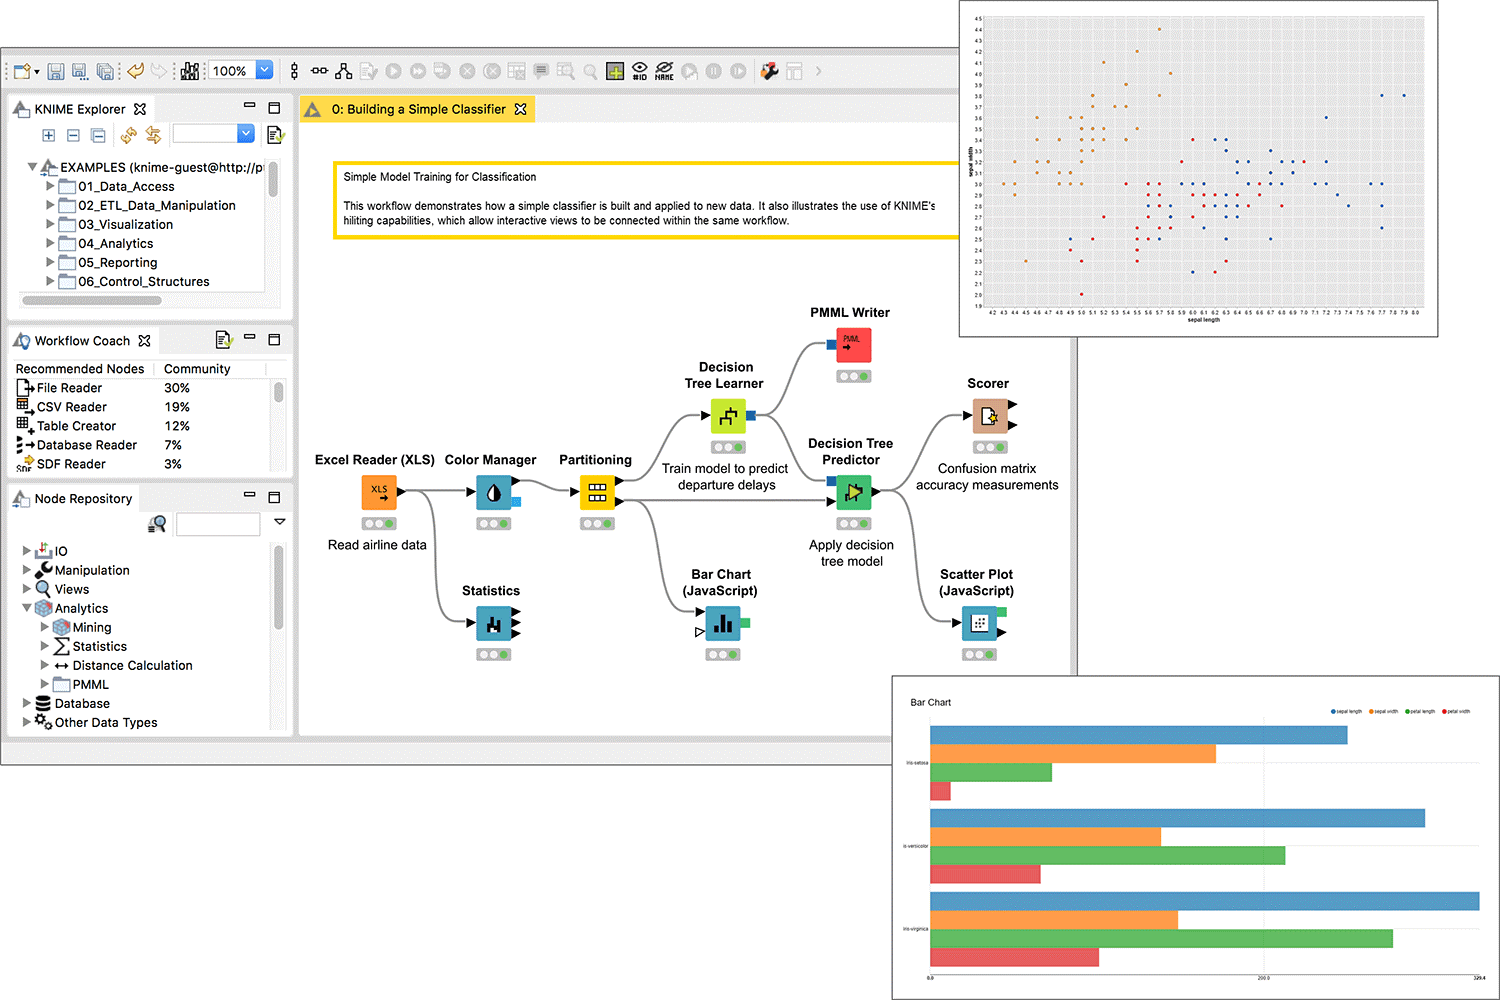
Konstanz Information Miner or KNIME is a free and open-source data analytics, reporting, and integration tool. KNIME allows users to browse 2000 nodes to build workflows, model each step of the analysis, control the flow of data, and keep their work updated.
No prior programming knowledge is required to use KNIME as a data analytics tool for deriving insights. The product mixes tools from various areas with KNIME native nodes within a single workflow, incorporating scripting in machine learning, Python or R, or connectors to Apache Spark.
KNIME Dashboard
(Image source: KNIME.com)
The open-source KNIME Analytics Platform may be employed to clean and gather data, make reusable components accessible to everyone, and create Data Science workflows.
Enterprises can use the KNIME Server platform for the deployment of Data Science workflows, team collaboration, management, and automation.
Top Companies Using KNIME
Companies including Siemens, Novartis, Deutsche Telekom, and Continental use KNIME as a data analytics tool to make sense of their data and extract meaningful insights.
KNIME Pricing Information
The KNIME Analytics Platform is available as a free download. For enterprise users, KNIME Server comes in three variants:
KNIME Server Small is designed for small teams, enabling them to exchange workflows and execute them remotely.
KNIME Server Medium enables additional KNIME WebPortal consumers to use workflows within KNIME Analytics Platform via their browser, and includes the REST API.
An annual subscription costs $29, 000 for five users and four cores for execution.
KNIME Server Large allows multiple installations as well as unlimited WebPortal consumers, and is intended for larger teams needing to collaborate across business units or across the globe.
An annual subscription costs $52, 000 for five users and four cores for execution.
#9 Data Analytics Tool - Talend

(Image source: ZDNet)
About Talend
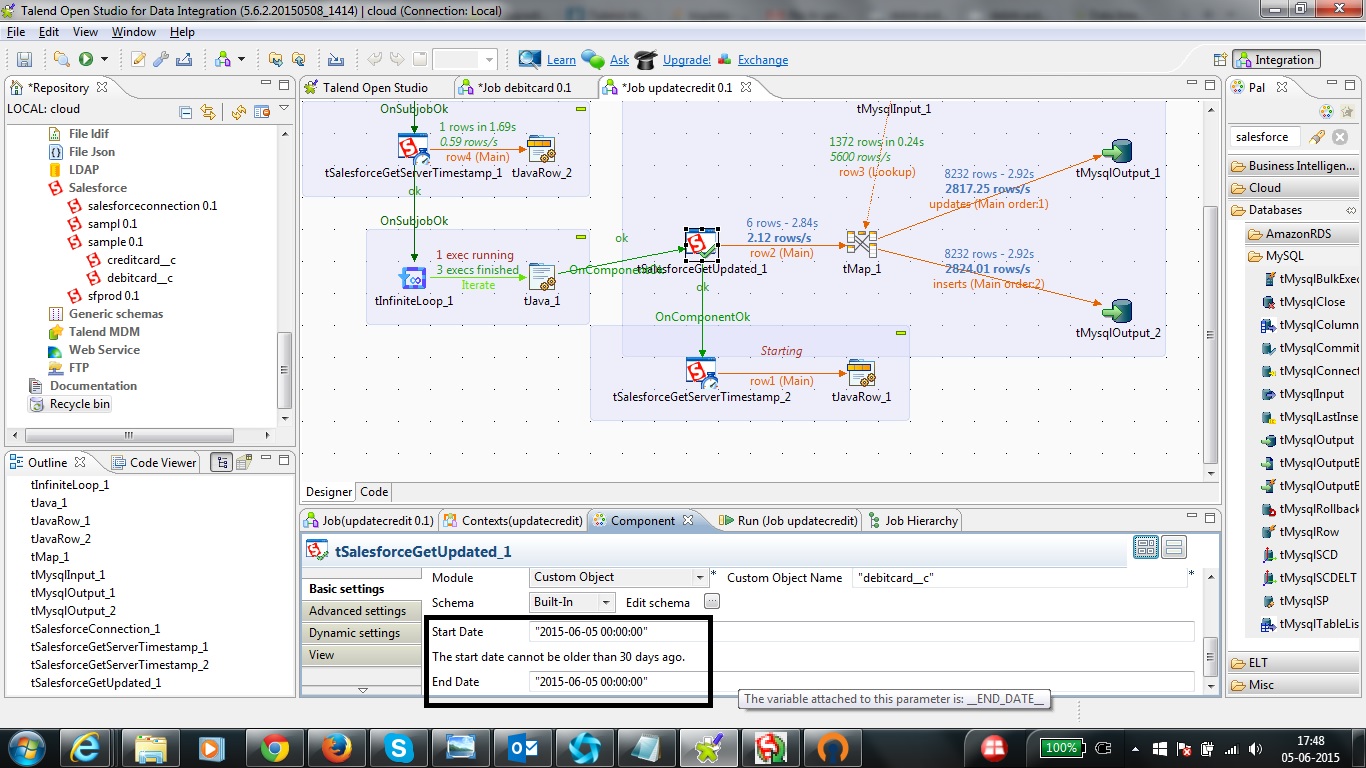
Developed in the Eclipse graphical development environment, Talend is one of the most powerful data integration ETL (Extract Transform Load) tools available on the market. Talend lets users easily manage all the steps involved in the ETL process, and aims to deliver compliant, accessible, and clean data for everyone.
It was named as a Leader in Gartner’s Magic Quadrant for Data Quality tools 2021.
Five products make up the Talend stable: Talend Open Source, Stitch Data Loader, Talend Pipeline Designer, Talend Cloud Data Integration, and Talend Data Fabric.
Talend Dashboard
(Image source: Talend Community)
Talend delivers complete and clean data at the moment you need it, by maintaining data quality, providing Big Data integration, cloud API services, preparing data, and providing a Data Catalogue and Stitch Data Loader. The Talend Cloud is now available in Microsoft Azure Marketplace.
Top Companies Using Talend
Enterprises ranging from small startups to multinational companies such as ALDO, ABInBev, EuroNext, and AstraZeneca are using Talend to make critical decisions.
Talend Pricing Information
Talend Open Source is free to all users. The paid version of Stitch Data Loader ranges from $100-1,000 per month. And Talend Cloud Data Integration costs $1,170 per user per month.
#10 Data Analytics Tool - Power BI
(Image source: Power BI)
About Power BI
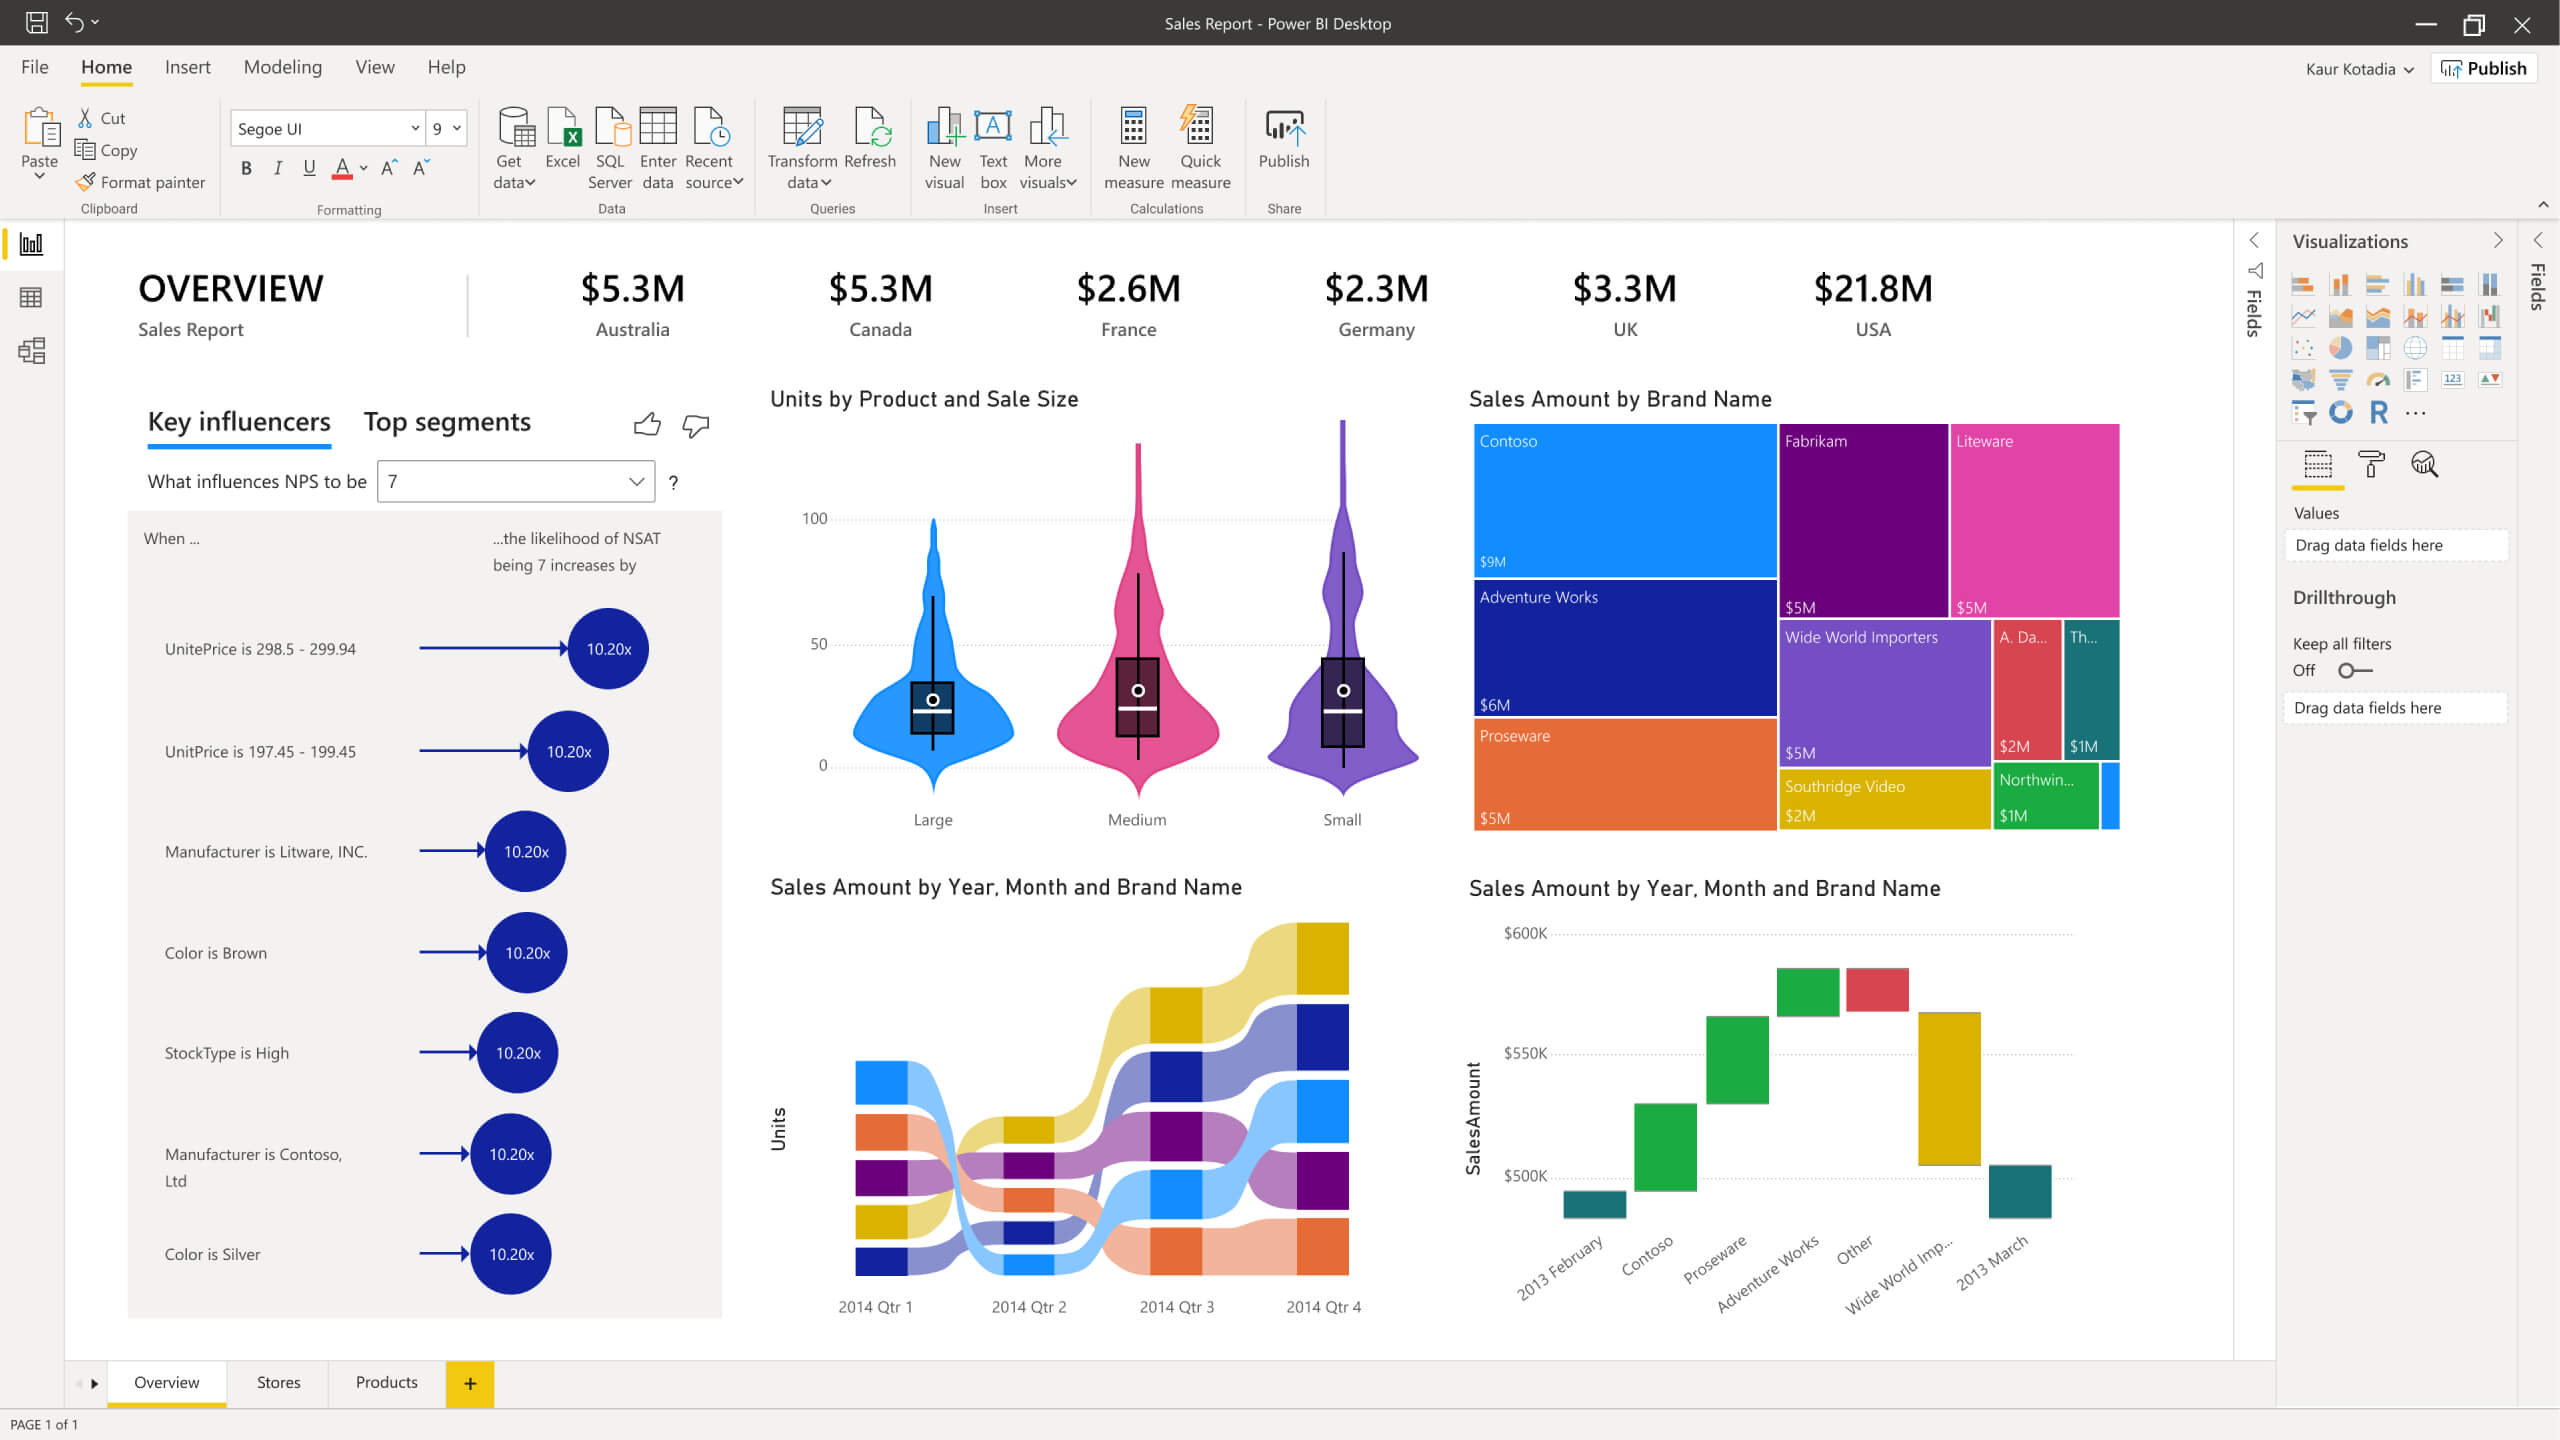
Power BI is a business analytics product from Microsoft. Its data analytics tool collection consists of several products, including Power BI Desktop, Power BI Pro, Power BI Premium, Power BI Mobile, Power BI Embedded, and Power BI Report Server.
In addition, Power BI has recently come up with a number of solutions such as Azure + Power BI and Office 365 + Power BI, to help users analyze their data, connect the information, and protect data across various Office platforms.
Power BI was named as a leader for the 14th consecutive year in the Gartner 2021 Magic Quadrant for Analytics and Business Intelligence Platforms.
Power BI Dashboard
(Image source: Power BI)
Power BI provides interactive visualisations with self-service business intelligence capabilities, and tools enabling users to create dashboards and reports by themselves.
Top Companies Using Power BI
Multinational organisations such as Adobe, Heathrow, Worldsmart, and GE Healthcare are using Power BI to achieve powerful results.
Power BI Pricing Information
Each of the Power BI variants has a limited free trial.
Prices for Power BI Pro start at $9.99 per user per month.
Power BI Premium has a monthly charge of $4,995 per dedicated cloud compute and storage resource with an annual subscription.
ZSAH Data & Analytics Offerings
As you can see, data analytics tools come in all shapes, sizes, and price points. It’s an evolving market, and whatever your circumstances, there’s a solution out there that’s appropriate for you.
Here at zsah, we also offer data analytics strategy to help organisations access, exploit and derive analytical value from their data.
Partnered with AWS, Tableau, Databricks and Verizon, zsah's bespoke four-step data & analytics approach helps our clients improve business outcomes through enhanced exploitation of existing data assets, and the realisation of data aspirations.
Stage 1. Strategy
- We assess organisations against a data and analytics maturity model and define a blueprint for the journey.
- Services include Data audit & Analytic maturity assessment, Data Architecture, and Data Strategy
Stage 2. Execution
- We assist in the delivery of technical and business change.
- Services include Data Quality, ETL Development, Data Engineering, and Data Science.
Stage 3. Embed
- We help create a lasting data governance model and data culture for decision making.
- Services include Data Governance, Data target operating models (DataOps), and Training.
Stage 4. Partner
- We provide ongoing support to flex and adapt to the changing needs of organisations.
- Services include Ongoing Support & Maintenance, and Resource Augmentation.
Apart from the above-mentioned service, we are also offering Tableau Training to help you explore the world of data visualisation!
If you’d like to learn more about how our highly customised services can assist your data analytics operations, feel free to reach out to us NOW.
Now It’s Your Turn!
Do you enjoy our article? Or do you have any preferred data analytics tool that's not on the list?
Leave a comment below and let us know, we would love to hear from you.